
內容簡介
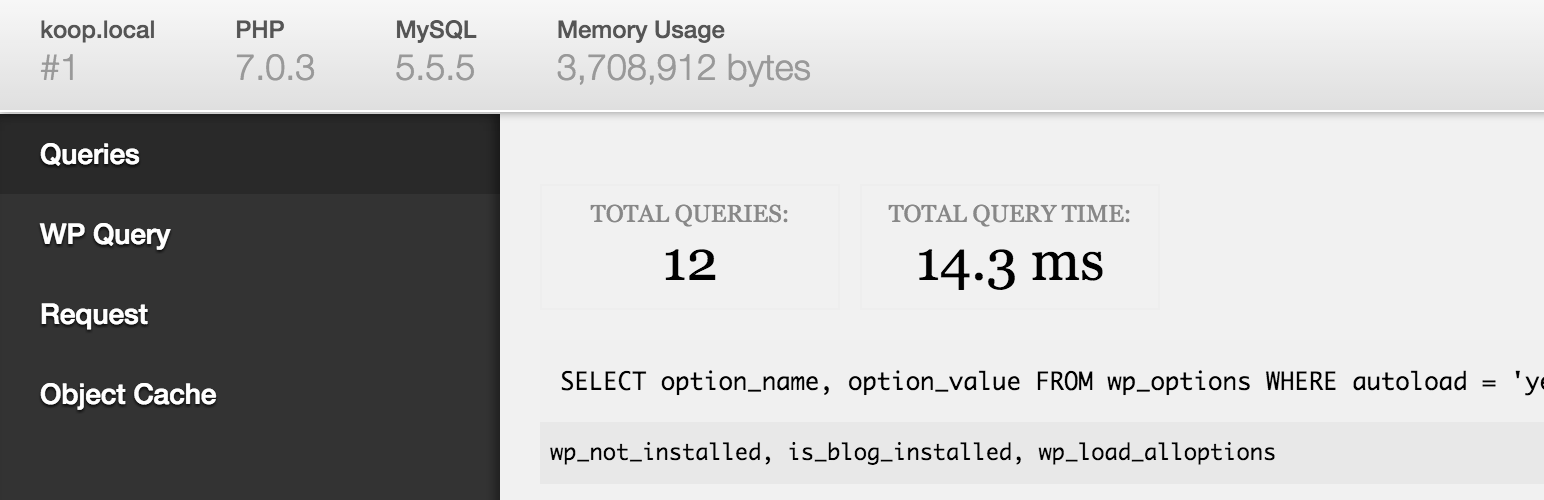
在管理列上新增一個除錯選單,顯示查詢、快取及其他有用的除錯資訊。
開發者必備的外掛!
當啟用WP_DEBUG時,也會追蹤 PHP 的警告和注意事項,使它們更容易找到。
啟用SAVEQUERIES時,會追蹤和顯示 MySQL 查詢。
要啟用這些選項,請在您的 wp-config.php 檔案中添加以下代碼:
define( 'WP_DEBUG', true );
define( 'SAVEQUERIES', true );
使用Debug Bar Console 外掛添加 PHP / MySQL 控制台。
還有其他許多其他的外掛提供更多的洞察力,例如註冊的文章類型、短代碼、WP Cron、語言檔案加載、作用及過濾器等等。只需在外掛目錄中搜尋「Debug Bar」即可。
外掛標籤
開發者團隊
📦 歷史版本下載
原文外掛簡介
Adds a debug menu to the admin bar that shows query, cache, and other helpful debugging information.
A must for developers!
When WP_DEBUG is enabled it also tracks PHP Warnings and Notices to make them easier to find.
When SAVEQUERIES is enabled the mysql queries are tracked and displayed.
To enable these options, add the following code to your wp-config.php file:
define( 'WP_DEBUG', true );
define( 'SAVEQUERIES', true );
Add a PHP/MySQL console with the Debug Bar Console plugin.
There are numerous other add-ons available to get more insight into, for instance, the registered Post Types, Shortcodes, WP Cron, Language file loading, Actions and Filters and so on. Just search the plugin directory for ‘Debug Bar’.