
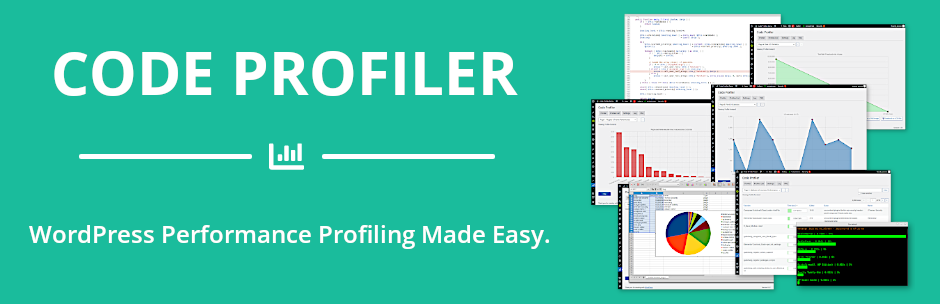
內容簡介
Code Profiler 是一款用於測量 WordPress 外掛和佈景主題性能的工具,能夠快速找出潛在的問題,並提供詳細的分析報告,幫助使用者優化網站速度。
【主要功能】
• 外掛與佈景主題性能分析
• PHP 腳本、類別、方法與函數性能分析
• 數據庫查詢與檔案 I/O 操作監控
• 支援 GET/POST 方法與自訂 HTTP 標頭
• 生成 PNG 圖表與 CSV 檔案匯出
外掛標籤
開發者團隊
② 後台搜尋「Code Profiler – WordPress Performance Profiling and Debugging Made Easy」→ 直接安裝(推薦)
📦 歷史版本下載
原文外掛簡介
A profiler to measure the performance of your WordPress plugins and themes.
Code Profiler helps you to measure the performance of your plugins and themes at the PHP level and to quickly find any potential problem in your WordPress installation.
You can profile the frontend and backend of WordPress, as well a cron events, a custom URL, send a POST payload, custom cookies and HTTP headers to profile a contact form, a checkout process or an AJAX action among many other possibilities.
It generates an extremely detailed and easy to read analysis in the form of charts and tables that shows not only which plugin or theme, but also which PHP script, class, method and function is slowing down your website. It displays many useful additional information such as database queries, file I/O operations and disk I/O usage as well.
It makes it very simple to locate any bottleneck problem in your themes or plugins in order to solve it and speed up your website.
Install, activate it and you can start profiling your site right away.
Features
Plugins & themes performance profiling.
[Pro] Scripts performance profiling.
[Pro] Methods & functions performance profiling.
[Pro] Database queries performance.
[Pro] Remote connections monitoring.
[Pro] File I/O operations monitoring.
File I/O statistics.
Disk I/O monitoring.
WP-CLI integration.
Export charts in PNG image format.
GET/POST methods, custom cookies and HTTP headers.
[Pro] Export all tables and charts in CSV file format.
[Pro] Filtering options
Learn more about Code Profiler Pro.