
內容簡介
Debug This是由友好Macho Themes團隊打造、維護和運營的獨立外掛程式。
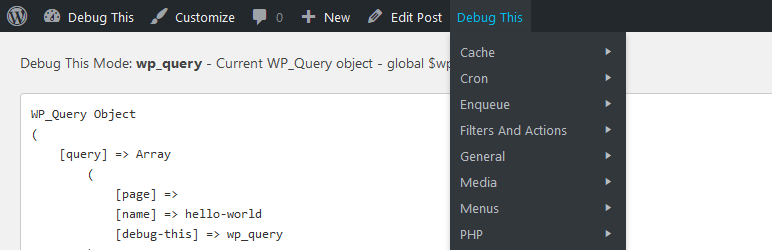
對於管理員、開發人員和支援人員,Debug This提供了大量的有關WordPress安裝的信息,全部顯示在前端管理工具欄中。
當前WP_Query對象
博客信息和選項
嵌入式提供程序
在渲染的HTML中的檔案(CSS,圖像,JavaScript)
過濾器和動作
圖像大小
全局和常量
菜單
對象緩存統計信息
插件、必需插件和附加功能
重寫規則
查詢
PHP和服務器信息
貼附件
貼類型
已佇列的腳本和樣式
短代碼
側邊欄和部件
分類和术语
主題
用戶
WP定期排程和作業
WP調試記錄
Debug This可幫助您節省花在解決問題上的時間和精力。您無需編寫複雜的測試程式碼,只需從管理工具欄中輕鬆地找出您需要獲得的信息。
例如,當查看單個帖子時,您可以查看:
帖子附件列表
正在顯示哪些菜單和側邊欄
帖子類型,帖子字段和元數據
當前查詢變量和查詢字符串
應用的重寫規則
作者
分類和术语
等等。
現在相容於Kint!
不要迷失在深度數組和對象中。安裝這個很棒的插件,組織和隔離您的調試輸出:
Kint Debugger
推薦的外掛程式
What The File – 無法正確識別模板檔案。
升級
Debug This函數
可以輕鬆創建新的調試模式:
add_debug_extension(
$mode,
$menu_label,
$description,
$callback,
$group = '中央'
);
例如:
add_debug_extension(
'actions',
__('動作', 'debug-this'),
__('$wp_actions 包含所有活動註冊動作', 'debug-this'),
'foo_callback',
'過濾器和動作'
);
function foo_callback($buffer, $template){
global $wp_actions;
$debug = print_r($wp_actions, true);
return $debug;
}
您可以在調試模式頁面的頁面標題中添加鏈接。將此程式碼放在您的調試回調函數中。
add_debug_header_link('http://urltolink', 'Link Label');
可以使用remove_debug_extension($mode);來刪除擴展。
無需PRE標籤
如果您不希望您的調試輸出被包圍在PRE標籤中,只需在您的擴展中設置以下內容:
Debug_This::$no_pre = true;
保存的查詢和執行時間
通過使用以下靜態屬性,可以檢索保存的查詢和執行時間:
Debug_This::$execution_time
Debug_This::$queries –必須定義為true
網址助手
Debug_This::get
外掛標籤
開發者團隊
原文外掛簡介
For admins, developers, and support staff, Debug This provides a ton of information about your WordPress installation, all from the front-end admin bar.
The current WP_Query object
Blog info and options
Embed providers
Files in rendered HTML (CSS, images, JavaScript)
Filters and actions
Images sizes
Globals and constants
Menus
Object cache stats
Plugins, must-use plugins, and dropins
Rewrite rules
Queries
PHP and server information
Post attachments
Post types
Scripts and styles enqueued
Shortcodes
Sidebars and widgets
Taxonomies and terms
Themes
Users
WP cron schedules and jobs
WP debug log
Debug This helps you save time and effort when trying to figure out what’s going on. Instead of hardcoding debug snippets or writing complex unit
tests for small functionality, you can simply bring to the surface what you need right from the admin bar.
For example, when viewing a single post, you can see:
a list of post attachments,
which menus and sidebars are being displayed,
the post type, post fields, and meta data,
the current query variables and query string,
the rewrite rules applied,
the author,
the terms,
and much more.
Extend
Debug This Functions
New debug modes can be created easily:
add_debug_extension(
$mode,
$menu_label,
$description,
$callback,
$group = 'General'
);
Example
add_debug_extension(
'actions',
__('Actions', 'debug-this'),
__('$wp_actions contains all active registered actions', 'debug-this'),
'foo_callback',
'Filters And Actions'
);
function foo_callback($buffer, $template){
global $wp_actions;
$debug = print_r($wp_actions, true);
return $debug;
}
You can add links to the header of a debug mode page. Place this code within your debug callback function.
add_debug_header_link('http://urltolink', 'Link Label');
Extensions can be removed as well using remove_debug_extension($mode);
No PRE Tags
If you don’t want your debug output to be enclosed in PRE tags, simply set the following in your extension:
Debug_This::$no_pre = true;
Saved Queries and Execution Time
Retrieve saved queries and execution time by using the following static properties:
Debug_This::$execution_time
Debug_This::$queries – SAVEQUERIES must defined as true
URL Helpers
Debug_This::get_current_debug_url() – current URL with the debug query
Debug_This::get_escape_url() – used for the debug escape link that links to original page URL
WP Actions
debug_this – receives the $mode arg – outputs the debug code sent from the extension modes. The default action is set to priority 5. This allows you to prepend or append any output without conflict using less or greater priorities.
WP Filters
There are a few filters you can use to customize Debug This to your needs:
debug_this_template – receives $template arg – Use your own template
debug_this_default_mode – receives $mode arg – Alters the mode for the parent DT admin bar button link.
debug_this_output – receives $output, $mode args – Filter debug content before it’s rendered
JavaScript
To access the built-in Debug This JS functionality, enqueue your custom script with the dependency set to debug-this. Your script will inherit a jQuery dependency.
Object: debugThis
debugThis.mode – current mode
debugThis.defaultMode
debugThis.template – current included template
debugThis.queryVar – the defined query string variable
Functions:
isDebug()
getDebugMode() – uses isDebug()
Events:
A jQuery debug-this event is fired from the footer. You can hook into this event with the following;
jQuery(document).bind('debug-this', function(event, debugThis){
console.log(debugThis);
});
Helper Functions
There are three included functions to help you work with files.
debug_this_get_file_ownership($file) – returns array('name' => $name, 'group' => $group)
debug_this_get_file_perms($file) – returns string – Example: 0775
debug_this_convert_perms_to_rwx($perms) – returns string – converts permission number to RWX format – Example: 0755 folder becomes drwxr-xr-x