內容簡介
Qaiyo Web Performance Surgeon 是一款專注於網站效能優化的外掛,能夠精確識別網站速度問題的來源,並提供一鍵修復功能,幫助使用者提升網站性能。
【主要功能】
• 精確的檔案與功能歸因
• 實際訪客渲染測量
• 每個問題的時間節省估算
• 資料庫分析與查詢檢測
• 外部請求阻塞檢測
• 安全的一鍵修復選項
外掛標籤
開發者團隊
② 後台搜尋「Qaiyo Web Performance Surgeon」→ 直接安裝(推薦)
原文外掛簡介
Most performance tools tell you that your site is slow. Qaiyo Web Performance Surgeon tells you what is slow, where it comes from, and how much you would save by fixing it — then fixes the safe ones in one click.
It measures a real, anonymous visitor render (not your logged-in admin view) by running a tokened loopback request, and attributes every cost back to the exact plugin, file and line responsible.
Features
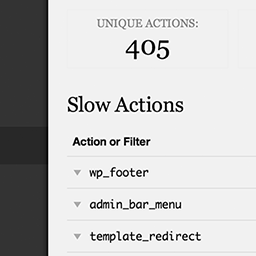
File- and function-level attribution — every slow query, hook and asset is traced to the exact plugin, file and line responsible, not just “the database is slow”.
Measures the real visitor render — a tokened, anonymous loopback captures the logged-out front-end page, not your admin-skewed view.
Estimated time saving per finding — every issue is ranked with an honest millisecond estimate, so you fix the biggest wins first.
Database profiling — per-query timing, duplicate-query detection and bloated autoloaded-option detection.
Hook and callback timing — per-callback cost with plugin attribution, captured with low overhead (no per-call backtraces).
Blocking HTTP detection — flags slow external requests made while the page renders.
Asset inventory — enqueued scripts and styles listed with their owning plugin.
Real browser metrics — Largest Contentful Paint, Cumulative Layout Shift, long tasks and navigation timing from an actual browser render.
Image checks — finds images served far larger than they are displayed (with the wasted kilobytes) and images that render without width/height, which makes the page jump.
Duplicate asset detection — spots the same library shipped twice by different plugins, or the same file registered under two handles.
Server & environment tab — the performance checks WordPress itself runs (object cache, page cache, PHP and database versions, cron, debug mode), collected in one place.
Compared with your last scan — every scan shows whether server time, query count and findings went up or down since the previous scan of the same URL.
Performance score on your dashboard — your latest scan is condensed into a single 0–100 score on a speedometer gauge, shown in the shared Qaiyo ecosystem dashboard widget (provided by Qaiyo Admin Booster) so you see how the site is doing without opening the plugin.
Safe one-click fixes — reversible toggles for common wins; no source files are ever modified.
Zero overhead on live traffic — measurement only switches on after a scan token has been validated against the record that issued it; normal visits pay nothing.
Available in 11 languages.
What it measures
Database — every query with its execution time, paired to the calling plugin/file/line (via SAVEQUERIES), plus duplicate-query and autoloaded-option detection.
Hooks — per-callback timing with plugin attribution, captured without per-call backtraces (low overhead).
HTTP — outbound requests made during render, flagging blocking external calls.
Assets — enqueued scripts and styles with their owners.
Browser — real LCP, CLS, long tasks and navigation timing, captured from an actual browser render.
Diagnosis and one-click fixes
The rule engine turns raw measurements into ranked findings with an estimated time saving for each, and offers safe, reversible one-click fixes for common wins:
Disable the emoji detection script
Disable wp-embed.js
Remove jQuery Migrate
Dequeue front-end Dashicons
Stop autoloading a bloated option
Remove the legacy RSD / Windows Live Writer links from the page head
Turn off XML-RPC (only offered when nothing on the site appears to need it)
Stop self-pingbacks when you link between your own posts
Remove the “?ver=” query string from static assets, for caching layers that skip versioned URLs
Every fix is a toggle you can undo — no source files are ever rewritten.
Privacy
Scans run on your own site. No data is sent to any third party.