
內容簡介
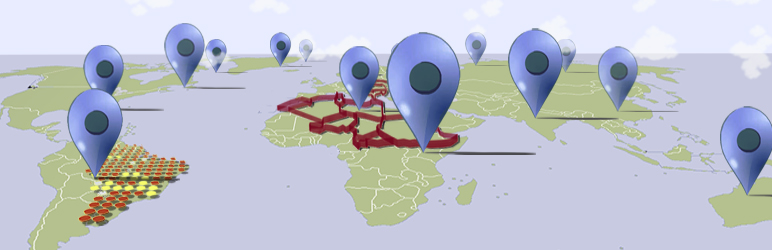
地圖可視化程式可以讓使用者匯入 CSV 檔案並使用外掛程式的介面製作出一個地圖。
當您成功匯入(或建立)一個資料來源後,您可以在地圖上視覺化它並且透過簡碼 (shortcode) 將其新增至文章/頁面中。
所有簡碼都可以透過外掛程式的介面輕易地建構完成。
CSV 檔案格式
CSV 檔案要匯入成功,必須遵從以下規則:
第一行必須包含所有欄位名稱:
如果您使用地理座標,第一與第二個欄位的名稱必須分別為 “Latitude “和 “Longitude ”。
如果您使用地址,第一行名稱必須為 “Address ”,外掛程式會進行地理編碼。
如果您希望使用多邊形,第一行名稱必須為 “Polygon ”。多邊形資料格式應為 Well-Known Text。
第二行必須包含每個欄位所使用的資料類型:
可用的資料類型包括 “INT”、“FLOAT” 與 “TEXT”。
對於 “Latitude ”及 “Longitude ”的欄位名稱,要使用的資料類型為 “FLOAT”。
對於 “Polygon” 或 “Address” 的欄位名稱,要使用的資料類型為 “TEXT”。
簡碼格式
此外掛程式簡碼的一般格式為 [visualise]。可用的屬性包括:
“file_name”:您希望視覺化的匯入檔案名稱。
“map”:用於視覺化的地圖類型。您可以在 “Satellite” 或 “Streets” 地圖中進行選擇,預設值為 “Streets”。
“type”:可視化類型。您可以選擇將自己的資料視覺化為 “polygon” 或 “marker”。預設類型為 “marker”。
“marker_type”:選擇要固定在所選地圖上的 “simple marker” 或 “circle_marker”。預設標記為 “simple marker”。
“category”:您的檔案標題名稱,它將根據所選標記類型區分數據。
“colorant”:圓形標記和多邊形的顏色,用於區分數據。
“circle_radius”:圓形標記的半徑。預設值為 5,建議在 1-10 的範圍內調整。
“fill_opacity”:圓形標記和多邊形的透明度級別。預設值為 0.3,建議在 0.1-1 的範圍內調整。
“center_point”:用於設定地圖初始中心點的地址。
“zoom”:地圖的初始縮放級別。值 1 顯示整個世界地圖,預設縮放級別為 3。
外掛標籤
開發者團隊
原文外掛簡介
Map Visualizer allows users to import csv files, and to create a map out of them using the plugin’s interface.
After you have successfully imported (or created) a data source, you can visualise it on a map and add it to your posts/pages with a shortcode.
All shortcodes can be constructed easily through the plugin’s interface.
CSV File Format
In order for the CSV file to be imported successfully, its format must comply with the following rules:
The first row must contain all the Header names:
If you use geographical coordinates, the headers of the first two column must be named “Latitude” and “Longitude” respectively.
If you use addresses, the first column must be named “Address” and the plugin will geocode the data accordingly.
If you wish to use polygons, the first column must be named “Polygon”. Format of polygon data should be of Well-Known Text.
The second row must contain the data type of each column:
Available data types include “INT”, “FLOAT” and “TEXT”.
For “Latitude” and “Longitude” headers, the data type to be used is “FLOAT”.
For “Polygon” or “Address” headers, the data type to be used is “TEXT”.
shortcode format
The general format of this plugin’s shortcodes is [visualise]. Available attributes include:
“file_name” : The name of the file imported you wish to visualise.
“map” : The map type to be used for the visualization. You can choose between “Satellite” or “Streets” maps and the default one is “Streets”.
“type” : Type of visualization. Either visualise your data as “polygon” or as “marker”. Default type is “marker”.
“marker_type” : Choose between “simple marker” or “circle_marker” to be pinned on the chosen map. The default markers are “simple marker”.
“category” : Header Name of your file, which will be used to differentiate the data based on the marker_type chosen.
“colorant” : Color of circle_markers and polygons, used to differentiate the data.
“circle_radius” : Radius of circle_markers. The default value is 5, and it is advised to stay between a 1-10 scale.
“fill_opacity” : Level of opacity for circle_markers and polygons. The default value is 0.3, and it is advised to stay between a 0.1-1 scale.
“center_point” : An Address for setting the initial center point of the map.
“zoom” : Initial zoom of the map. Value 1 shows the entire world map and the default zoom used is 3.