內容簡介
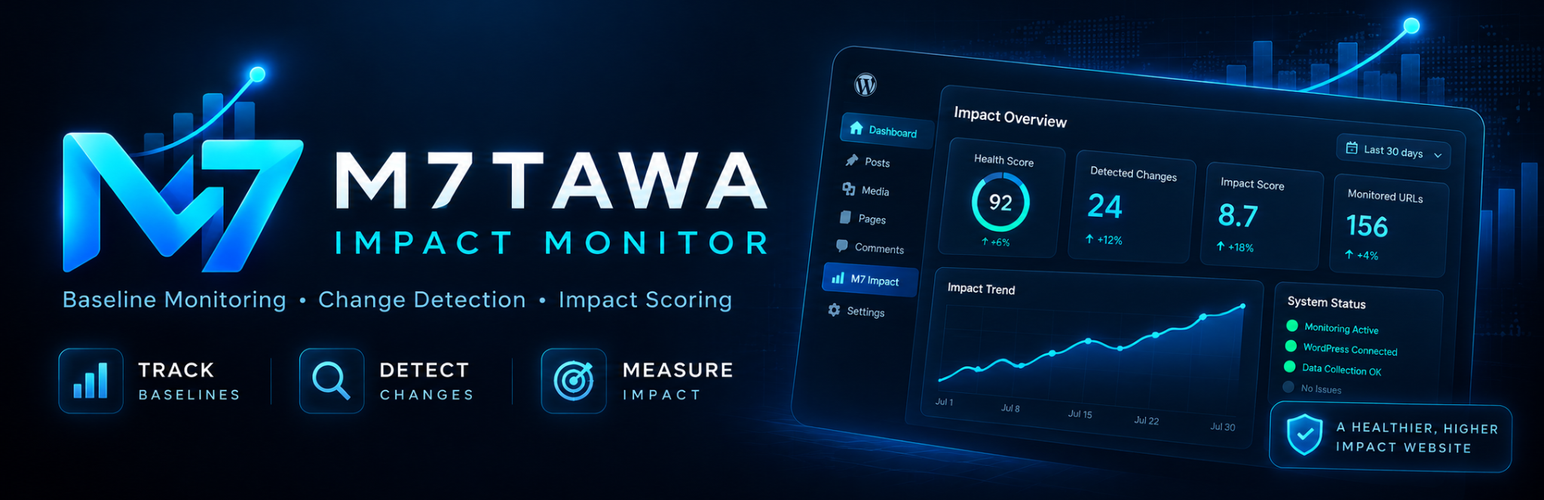
M7tawa Impact Monitor 是一款輕量級的事件驅動診斷工具,專為 WordPress 管理員和開發者設計。此外掛提供詳細的變更紀錄,幫助使用者追蹤擴充功能的安裝、啟用、停用及更新後的影響,並不會修改網站設定。
【主要功能】
• 建立當前網站的手動基準
• 紀錄擴充功能安裝後的可測變更
• 顯示每個擴充功能的生命週期時間線
• 顯示新增和移除的資料庫表名稱
• 計算透明的影響分數
• 提供擴充功能的影響檔案
外掛標籤
開發者團隊
原文外掛簡介
M7tawa Impact Monitor is a lightweight, event-based diagnostic tool for WordPress administrators and developers.
Version 2.8.3 remains read-only for site and extension data. It does not delete tables, remove options, disable assets, or change WordPress settings.
Version 2 adds detailed before/after evidence instead of summary counts alone.
Features:
Create a manual baseline of the current site.
Record measurable changes after extension installation, activation, deactivation, updates, and successful deletion.
Show a per-extension Lifecycle Timeline with event filtering, version transitions, and first/last monitored dates.
Show exact names of added and removed database tables, cron hooks, post types, taxonomies, and REST routes.
Index option metadata without copying option values: option name, autoload state, and byte size only.
Skip detailed option indexing automatically on sites with more than 20,000 options to keep scans conservative; autoload total remains available.
Show added, removed, and size/autoload-changed options after a version 2 baseline.
Show role and capability changes.
Show version transitions for monitored updates when available.
Provide an impact profile for every installed extension, while clearly marking extensions that only exist in the baseline.
Preserve v1.x history during upgrade.
Require explicit confirmation before clearing the monitor’s own history.
Load no frontend CSS or JavaScript.
Keep only the latest 100 monitoring events.
Calculate a transparent 0–100 Impact Score from attributable observed evidence only.
Show Low, Moderate, High, or Very High technical impact without labeling extensions as good, bad, safe, or unsafe.
Break the score into Database, Runtime, WordPress Integration, and Footprint Breadth components.
Label partial scores when activation was not observed and leave baseline-only extensions unscored.
Show Impact Score before/after observed events and version updates.
Distinguish Current Impact Score from Peak Impact Score and show signed Event Impact Delta.
Keep a compact observed score history with Rising, Falling, Stable, or New history trend labels.
Show the top score contributors and conservative Attention Flags that explain what may deserve manual review.
Show a dedicated before/after score comparison for monitored updates and highlight notable score shifts of 10 points or more.
Show Observed or Partial confidence directly beside scored extension profiles.
Filter and sort extension profiles by impact level or score.
Use cron recurrence metadata when available so high-frequency schedules contribute more than infrequent schedules.
Never take automatic action based on a score.
After a successful extension deletion, run a read-only Residue Monitor check for remaining tables, options, transients, cron hooks, roles, post meta keys, and user meta keys.
Separate Observed residue from lower-confidence Likely related naming evidence instead of claiming uncertain ownership.
Recheck a stored residue report manually without deleting or modifying any site data.
Build a per-extension Dependency Map from the WordPress Requires Plugins header, reverse dependents, observed shared-resource evidence, and monitored footprint evidence.
Keep declared dependency metadata separate from observed integration evidence so shared resources are never presented as proof of dependency.
The monitor uses on-demand and event-based scans. It does not run heavy diagnostic scans on ordinary frontend page loads.