
內容簡介
everviz 是一個數據可視化工具,可以幫助您創建互動式圖表、地圖等,而無需編碼。
全球的新聞機構、傳訊團隊、政府、學生和研究人員都可以使用這個工具。
在 WordPress 中使用 everviz 來添加互動式可視化比添加圖片更容易。完美地融入現有的出版流程中。
所有的視覺化元素都可以完全自適應,並且會適應所有尺寸的設備和螢幕大小進行優化。everviz 提供簡單但功能強大的主題概念,可以將您的企業品牌元素(例如色板、字型、位置和標誌)整合到您的專案中。
使用 everviz 創建的所有專案都包括頂級的無障礙(A11Y)功能,在最相關的殘疾類別中都有良好的表現。
此外掛需要 everviz 帳戶才能使用。如果您還沒有帳戶,請先在此免費註冊!
產品特色:
- 透過互動內容提供更佳的閱讀體驗
- 無需編碼或設計技巧
- 可適用於任何設備
- 所有製作出來的可視化元素都符合您的品牌身份
- 輕鬆與團隊協作
- 最先進的 A11Y 功能有助於擴展觸及更多人群
- 透過連接至實時數據源更新您的發佈作品
- 下載製作的可視化元素,以供印刷版或靜態報告使用
- 與大多數常用的 WordPress 編輯器完美搭配使用
如何使用 everviz(先決條件)?
此外掛需要您擁有 everviz 帳戶,並在應用程式中發佈視覺化元素。也就是說,如果您沒有已發佈的地圖或圖表,則必須先在此註冊並創建您的第一個視覺化元素。
以下是如何使用 everviz 創建視覺化元素的方法:
1. 粘貼
直接輸入數據,將 CSV 文件拖到編輯器中,從 Excel 複製和粘貼,或通過 Google Sheet 整合連接到實時數據。
2. 選擇
我們直觀的編輯器允許您選擇圖表類型,編輯文本、字型和顏色,使您的數據更加突出。
3. 發佈
將您的互動式視覺化元素嵌入到 WordPress 網站、博客或內部網絡中,或將其導出為圖像。
了解更多有關如何使用 everviz 的信息,請訪問我們的説明文檔:https://www.everviz.com/help
如何使用此外掛?
插入視覺化元素
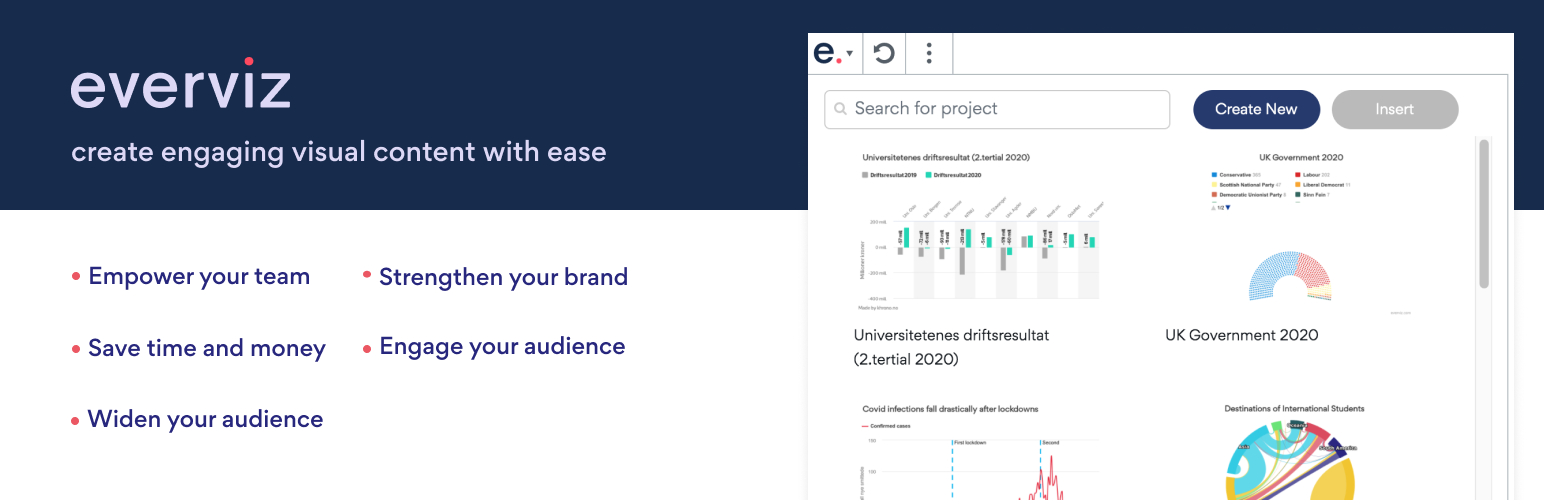
如果您找不到想要的可視化元素,請使用窗口頂部的搜索欄進行搜索,或通過窗口底部的頁碼進行尋找。當您找到要使用的視覺化元素後,點選它,然後點擊“插入”按鈕。
創建新的視覺化元素
要創建新的視覺化元素,請點擊窗口頂部的“創建新”按鈕。您將被重定向到 everviz 應用程式中以創建視覺化元素。前往https://www.everviz.com/help了解有關如何在 everviz 中創建視覺化元素的更多信息。
編輯視覺化元素
要編輯可視化元素,請點擊插入視覺化元素下方的“在 everviz 中編輯”按鈕。您將被重定向到 everviz 應用程式中。
外掛標籤
開發者團隊
② 後台搜尋「everviz – Charts, Maps and Tables – Interactive and responsive」→ 直接安裝(推薦)
原文外掛簡介
everviz is a data visualization tool that helps you create interactive charts, maps and more – without any coding involved.
Users include newsrooms, communication teams, governments, students and researchers across the globe.
Adding an interactive visualization in your WordPress with everviz is easier than adding an image. Ties perfectly into your existing publishing flow.
All visualizations are fully responsive, which means they automatically adapt and are optimized to all devices and screens of any size. everviz comes with a simple and powerful theme concept, which allows you to incorporate your corporate brand elements such as color palette, fonts, positioning and logos into your projects.
All projects created with everviz include state of the art accessibility (A11Y) functionality in the most relevant disability categories.
This plugin requires an everviz account. Sign up for free here first, if you don’t have one!
HIGHLIGHTS
– Engage readers with interactive content
– No coding or design skills required
– Works on any device
– All your visualizations will be consistent with your brand identity
– Collaborate with your team
– Reach out to bigger audience with state of the art accessibility (A11Y) functionality
– Keep your published work up to date with connecting to live data sources
– Download your visualizations for the print edition or static reports
– Ties perfectly into most popular WordPress editors
HOW TO USE EVERVIZ (PREREQUISITE)
This plugin requires an everviz account and a visualization published in the app. This means that you have to sign up here first and create your first visualization, if you don’t already have an account with published charts or maps.
Here’s how to use everviz to create visualizations from your data:
1. Paste
Enter data directly, drop a CSV file into the editor, copy & paste from Excel, or connect to live data via the Google Sheet integration.
2. Pick
Our intuitive editor lets you choose chart type, edit text, fonts and colors to make your data stand out.
3. Publish
Embed your interactive visualizations on your WordPress website, blog or intranet, or export them as images.
Learn more about how to use everviz in our help section: https://www.everviz.com/help
HOW TO USE THE PLUGIN
Inserting a visualization
If you can’t see the visualization you are looking for, search for it in the search bar at the top of the plugin window or navigate through the pagination at the bottom of the window. When you have identified the visualization you want, click it, and then click the “Insert” button.
Create a new visualization
To create a new visualization, click the “Create new” button at the top of the window. You will be redirected to the everviz app to create the visualization. Go to https://www.everviz.com/help to learn more about how to create visualizations in everviz.
Editing a visualization
To edit a visualization, click “Edit in everviz” below the inserted visualization. You will be redirected to the everviz app.
Deleting a visualization
To delete a visualization from your document, click the trash can symbol in the upper right corner of it.