
內容簡介
Debug Log Manager 可以讓您:
單擊啟用 WP_DEBUG 以記錄 PHP、數據庫和 JavaScript 錯誤,不需要手動編輯 wp-config.php 文件,完成後再禁用。
在自訂位置和以自訂檔案名稱為您創建 debug.log 檔案,以增強安全性。
將默認 / 現有的 debug.log 檔案內容複製到自定義的 debug.log 檔案中,並刪除默認 / 現有的 debug.log 檔案。這樣,日誌記錄可以繼續進行並進一步增強安全性。
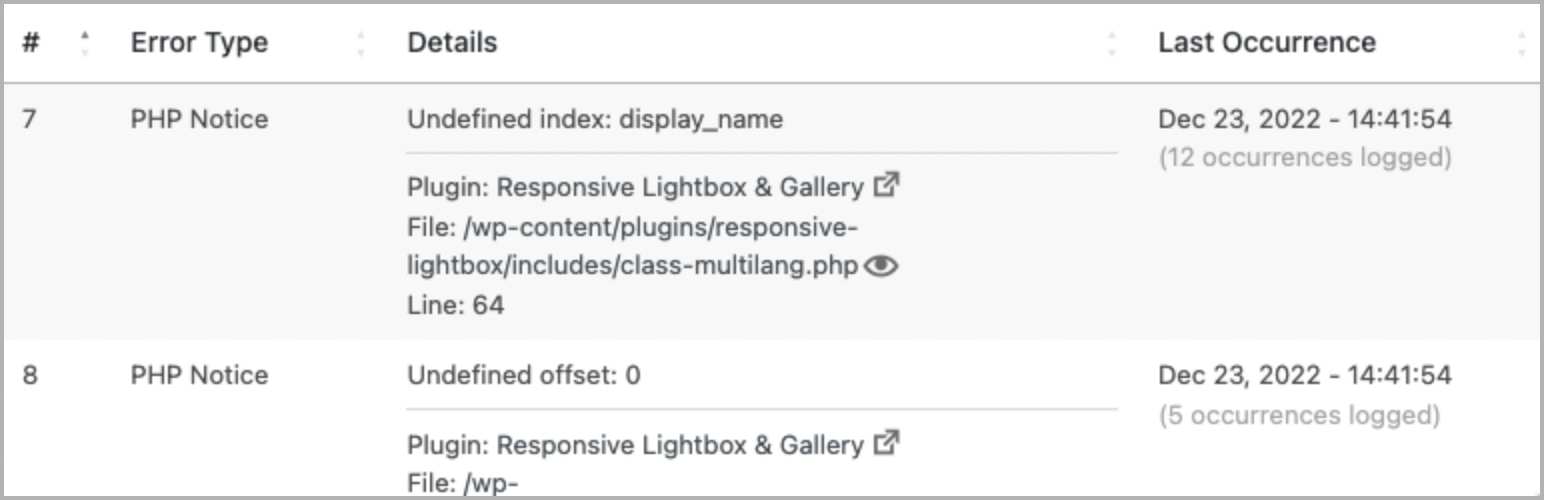
解析 debug.log 檔案,查看不同的錯誤以及它們最後出現的時間,這比查看可能充滿重複錯誤的原始日誌檔案更好。
快速查找和篩選更具體的錯誤以進行調試。
通過識別錯誤來源(核心 / 插件 / 主題)和分離文件路徑和行號,使錯誤詳細信息讀起來更容易。
輕鬆查看產生 PHP 錯誤的文件。這包括 WordPress 核心、插件和主題文件。
啟用自動刷新以自動加載新的日誌條目。無需手動重新加載瀏覽器標籤,或在命令行上使用 tail -f 日誌檔案。
輕鬆清除 debug.log 檔案以節省磁盤空間,更輕鬆地觀察您網站上新出現的錯誤。
在啟用錯誤記錄時,在管理列上顯示指示器。
添加一個儀表板小部件,顯示最新的錯誤日誌。
使用 error_log() 將錯誤信息輸出到您的調試日誌中。例如,對於簡單的基於字符串的錯誤信息,使用 error_log( $error_message ),或者使用 error_log( json_encode( $error ) ) 來檢查更複雜的錯誤信息,例如陣列或對象。
如果您喜歡更簡單、更緊湊的 Debug Log Manager 版本,可以選擇使用 系統儀表板插件。
回饋意見
非常感謝您在 評價 中留下您的好評!
您可以提供反饋意見,以幫助改進未來的版本。
有志者可以協助翻譯插件至其他語言。
您也可以參與 Github 存儲庫,貢獻代碼。
如果您願意捐贈支持我的工作,請點擊 此處的連結。
也推薦您使用以下插件
系統儀表板:集中管理 WordPress 的各種組件、過程和數據,包括服務器。
變數檢視器:在 wp-admin 中的中央儀表板上檢查 PHP 變數,方便調試。
代碼瀏覽器:帶有語法高亮功能的快速目錄瀏覽器和文件 / 代碼查看器。
數據庫管理插件:基於自定義主題的 Adminer 應用程序的清潔、易於使用的界面,安全地管理 WordPress 網站的數據庫。此插件僅在 Github 上提供。
管理和網站增強插件:可輕鬆增強各種管理工作流程和網站方面,同時替換多個插件。
外掛標籤
開發者團隊
② 後台搜尋「Debug Log Manager – Conveniently Monitor and Inspect Errors」→ 直接安裝(推薦)
📦 歷史版本下載
原文外掛簡介
Debug Log Manager allows you to:
Enable WP_DEBUG with one click to log PHP, database and JavaScript errors when you need to, and disable it when you’re done. No need to manually edit wp-config.php file.
Create the debug.log file for you in a non-default location with a custom file name for enhanced security.
Copy the content of the default / existing debug.log file into the custom debug.log file, and delete the default / existing debug.log file. So there is continuation in logging and enhanced security going forward.
Parse the debug.log file and view distinct errors and when they last occurred, which is better than looking at the raw log file (potentially) full of repetitive errors.
Quickly find and filter more specific errors for your debugging work.
Make error details easier to read by identifying error source (core / plugin / theme) and separating file path and line number.
Easily view files where PHP errors occurred. This includes WordPress core, plugin and theme files.
Enable auto-refresh to automatically load new log entries. No need to manually reload the browser tab, or to tail -f the log file on the command line.
Easily clear the debug.log file to save disk space and more easily observe newly occurring errors on your site.
Show an indicator on the admin bar when error logging is enabled.
Add a dashboard widget showing the latest errors logged.
Use error_log() to output error info into your debug log. e.g. error_log( $error_message ) for simple, string-based error message, or error_log( json_encode( $error ) ) when inspecting a more complex error info, e.g. array or object.
A simpler and more compact version of Debug Log Manager is included as part of the System Dashboard plugin, should you prefer a single plugin that does more.
What Users Say
“This is a great plugin for dev especially for people who tinker in the code.” ~PK Son
“I have used a couple of other logger plugins and this is by far the best one.” ~Brian Henry
“Another massive time-saving tool.“ ~Jeff Starr
Give Back
A nice review would be great!
Give feedback and help improve future versions.
Help translate into your language.
Github repo to contribute code.
Sponsor my work.
Check These Out Too
System Dashboard: Central dashboard to monitor various WordPress components, processes and data, including the server.
Variable Inspector: Inspect PHP variables on a central dashboard in wp-admin for convenient debugging.
Admin and Site Enhancements helps you to easily enhance various admin workflows and site aspects while replacing multiple plugins doing it.
WordPress Newsboard: The latest news, articles, podcasts and videos from 100+ WordPress-focused sources.