
內容簡介
透過幾個點擊建立並顯示數據圖表於您的網站上。輕鬆地將您的數據視覺化!
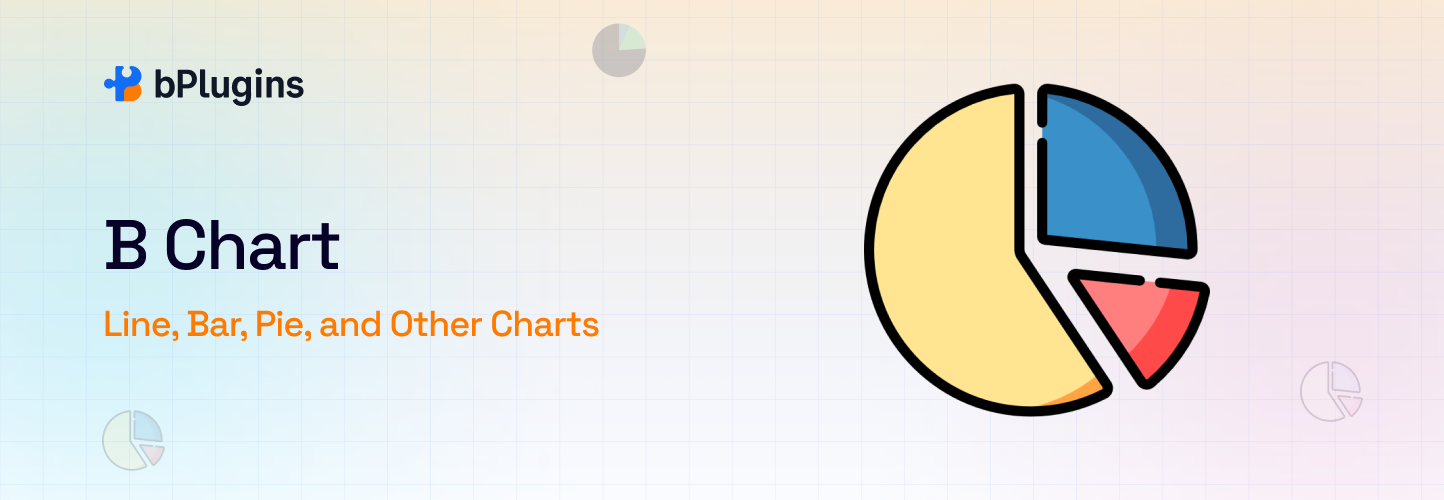
此外掛支援8種圖表類型:長條圖、折線圖、區域圖、圓餅圖、氣泡圖、雷達圖、極性圖和散佈圖。
現場演示
使用方式:
從儀表板菜單中選擇「B-Chart」-> 「新增」。
根據個人喜好配置圖表
從圖表編輯視窗中複製生成的短碼,貼到記事或網頁的短碼區塊中。
享受使用!
⭐請查看我們的其他 WordPress 插件-
🔥 HTML5 音訊播放器 - WordPress 最佳音訊播放器外掛。
🔥 HTML5 影片播放器 - WordPress 最佳影片播放器外掛。
🔥 PDF Poster - WordPress 的全功能 PDF 檢視器外掛。
🔥 StreamCast - WordPress 的全功能收音機播放器外掛。
🔥 3D Viewer - 在網頁上顯示互動式 3D 模型的外掛。
外掛標籤
開發者團隊
② 後台搜尋「B Chart – Line, Bar, Pie, and Other Charts」→ 直接安裝(推薦)
原文外掛簡介
Create and display a Data Chart on your site within a few click. Easily visualize your data!
This plugin supports 8 chart types: bar, line, area, pie, bubble, radar, polar, and scatter.
Live Demo
How To Use?
Go to -> B-Chart from Dashboard menu -> Add New.
Configure the Chart according to your preference
Copy the Generated shortcode from the chart edit screen and paste in shortcode block in the edit screen of a post or page.
Enjoy !!!
⭐ Checkout our other WordPress Plugins
🔥 Html5 Audio Player – Best audio player plugin for WordPress.
🔥 Html5 Video Player – Best video player plugin for WordPress.
🔥 PDF Poster – A fully-featured PDF Viewer Plugin for WordPress.
🔥 StreamCast – A fully-featured Radio Player Plugin for WordPress.
🔥 3D Viewer – Display interactive 3D models on the webs.