
前言介紹
- 這款 WordPress 外掛「Advanced Charts for Gutenberg Blocks Editor」是 2025-04-03 上架。
- 目前尚無安裝啟用數,是個很新的外掛。如有要安裝使用,建議多測試確保功能沒問題!
- 上一次更新是 2025-04-16,距離現在已有 18 天。
- 外掛最低要求 WordPress 6.0 以上版本才可以安裝。
- 外掛要求網站主機運作至少需要 PHP 版本 7.4 以上。
- 尚未有人給過這款外掛評分。
- 還沒有人在論壇上發問,可能目前使用數不多,還沒有什麼大問題。
外掛協作開發者
selimmw | bdthemes | shamim496 |
外掛標籤
csv | Pie | chart | graph | chart blocks |
內容簡介
總結:Chart Blocks for Gutenberg 是一個外掛程式,可將可自訂的圖表塊添加到 WordPress 區塊編輯器中。使用此外掛,使用者可以輕鬆地將互動式圖表(如條形圖、折線圖、圓餅圖等)嵌入其文章或頁面,以視覺上吸引人的格式展示數據。
**問題與答案:**
**1. Chart Blocks for Gutenberg 是什麼?**
- Chart Blocks for Gutenberg 是一個 WordPress 外掛程式,將可自訂的圖表和圖形區塊添加到 WordPress 區塊編輯器中。
**2. 使用者可以如何利用此外掛程式來展示數據?**
- 使用者可以輕鬆地將各種互動式圖表(如條形圖、折線圖、圓餅圖等)嵌入其文章或頁面,以視覺上吸引人的格式展示數據。
**3. Chart Blocks for Gutenberg 提供哪些主要功能?**
- 多種圖表類型:選擇條形圖、折線圖、圓餅圖等類型。
- 完全自訂:自訂圖表顏色、標題、軸、標籤等。
- 響應式設計:圖表自動調整以適應任何螢幕尺寸。
- 數據輸入:輕鬆手動輸入數據或上傳 CSV 檔案以自動生成圖表。
- 互動式圖表:滑鼠懸停效果、工具提示等。
- 即時數據整合:集成外部 API 以獲取即時數據圖表(進階用戶)。
- 匯出選項:允許使用者將圖表下載為圖像(PNG、SVG)。
原文外掛簡介
🚀 Elevate Your WordPress Content with Advanced Data Visualization! 🚀
Chart Blocks for Gutenberg transforms how you present data on your WordPress website. In today’s data-driven world, presenting information clearly and beautifully is essential for engaging your audience. Our powerful yet user-friendly plugin integrates seamlessly with the WordPress block editor, allowing anyone to create stunning, interactive charts and graphs without coding knowledge.
✨ Why Choose Chart Blocks for Gutenberg? ✨
In the competitive online landscape, standing out is crucial. Static text and basic images no longer capture user attention effectively. Chart Blocks for Gutenberg empowers you to transform complex data into visually compelling stories that engage visitors, increase time on page, and boost conversions. Whether you’re a blogger sharing statistics, a business showcasing growth, or an educator explaining concepts, our plugin provides the perfect tools to visualize your data professionally.
🔍 The Power of Data Visualization for WordPress 🔍
Research shows that humans process visual information 60,000 times faster than text. By incorporating beautiful, interactive charts into your content, you can:
Improve comprehension of complex information
Increase reader engagement by up to 80%
Boost memory retention of key facts and figures
Enhance the professionalism of your website
Simplify decision-making for your audience
Our plugin bridges the gap between powerful data visualization and WordPress simplicity, making professional charts accessible to everyone.
📊 Comprehensive Chart Types for Every Need 📊
Whatever your data visualization requirements, we’ve got you covered with our extensive library of chart types:
Bar Charts: Perfect for comparing values across different categories
Line Charts: Ideal for showing trends and changes over time
Pie & Donut Charts: Excellent for displaying proportional data and percentages
Area Charts: Great for showing cumulative totals across categories
Radar Charts: Best for comparing multiple variables at once
Polar Area Charts: Useful for highlighting variations in a cyclical dataset
Scatter Plots: Ideal for showing relationships between variables
Bubble Charts: Perfect for representing three dimensions of data
Horizontal Bar Charts: Alternative layout for comparing categories
Stacked Charts: Show composition changes over time or categories
Each chart type comes with dozens of customization options to ensure your visualizations perfectly match your website’s style and effectively communicate your message.
🎨 Unlimited Customization Possibilities 🎨
Unlike other chart plugins that lock advanced features behind paywalls, Chart Blocks for Gutenberg gives you complete creative control:
Rich Color Palettes: Choose from predefined professional color schemes or create your own custom palette to match your brand
Comprehensive Typography Controls: Customize titles, labels, legends, and tooltips with different fonts, sizes, and styles
Flexible Axis Configuration: Fine-tune your X and Y axes with custom ranges, step sizes, and formatting options
Interactive Legend Options: Position, style, and control interactivity of chart legends
Responsive Behavior Settings: Ensure your charts look perfect on all devices from desktops to smartphones
Animation Controls: Select from various animation types and durations for chart rendering
Advanced Tooltip Customization: Create informative, styled tooltips that appear on hover
Grid and Scale Options: Adjust background grids, ticks, and padding for optimal readability
The intuitive block editor interface makes these customizations accessible to users of all technical levels while providing the depth that professionals demand.
📱 Truly Responsive and Mobile-Friendly 📱
In today’s mobile-first world, your data visualizations must perform flawlessly across all devices. Chart Blocks for Gutenberg delivers:
Automatically Responsive Charts: Charts dynamically resize to fit any screen size
Touch-Optimized Interactions: Mobile-friendly tooltips and controls
Configurable Mobile Displays: Option to show simplified versions on smaller screens
Fast Loading Times: Optimized code ensures charts load quickly on mobile connections
Accessibility Compliance: Charts work with screen readers and keyboard navigation
Your data will look stunning and function perfectly for all visitors, regardless of their device.
📁 Flexible Data Management 📁
We understand that data comes in many formats, which is why our plugin supports multiple data input methods:
Simple Table Interface: Enter data directly into an intuitive table within the block editor
CSV Import: Upload CSV files to instantly create charts from existing data
Spreadsheet Copy/Paste: Copy data from Excel, Google Sheets, or other spreadsheet programs
WordPress Database Integration: Connect to your database to display dynamic site data
External API Support: Pull live data from external APIs for real-time charts
Reusable Chart Templates: Save chart configurations for consistent reporting
Data Update Controls: Set automatic refresh intervals for dynamic data sources
This flexibility ensures you can work with data in the way that best suits your workflow.
⚡ Performance Optimized ⚡
We’ve built Chart Blocks for Gutenberg with performance as a priority:
Lightweight Core: Minimal impact on page load times
Efficient Rendering: Charts render quickly even with large datasets
Lazy Loading Option: Charts can load only when scrolled into view
Caching System: Reduces server load for dynamic data charts
Optimized Assets: CSS and JavaScript files are minified and efficiently loaded
No jQuery Dependency: Modern vanilla JavaScript for better performance
Server-Side Rendering: Option for faster initial page loads
Your website’s speed remains lightning-fast even with multiple charts on a single page.
🔒 Privacy and Data Security 🔒
In an era of increasing privacy concerns, our plugin ensures:
100% On-Site Processing: All data visualization happens on your server
No External Dependencies: Charts don’t require connections to third-party services
GDPR Compliance: No personal data is collected or shared
Secure Data Handling: Safe processing of sensitive information
Self-Hosted Solution: Complete control over your data and its presentation
Your data remains yours alone, with no external services required to create professional visualizations.
🔄 Seamless WordPress Integration 🔄
Chart Blocks for Gutenberg works harmoniously with the WordPress ecosystem:
Native Block Editor Experience: Follows WordPress UI/UX patterns for intuitive use
Theme Compatibility: Works perfectly with any WordPress theme
Plugin Friendly: No conflicts with popular WordPress plugins
Multi-Site Compatible: Functions correctly in WordPress network installations
Classic Editor Support: Shortcode implementation for Classic Editor users
Translation Ready: Supports internationalization for global users
Role-Based Access Controls: Restrict chart creation and editing to specific user roles
The plugin feels like a natural extension of WordPress rather than a bolted-on addition.
💼 Professional Use Cases 💼
Chart Blocks for Gutenberg serves diverse professional needs:
Business Websites: Present financial results, growth metrics, and market analysis
Educational Institutions: Visualize research findings, student demographics, and learning outcomes
News Organizations: Create informative data journalism with embedded charts
Government Agencies: Display budget allocations, program results, and public data
Non-Profits: Illustrate impact metrics, donation allocation, and cause-related statistics
Healthcare Providers: Share health data, treatment outcomes, and research findings
Marketing Professionals: Showcase campaign results, audience demographics, and ROI
Personal Blogs: Enhance content with data-backed visualizations
E-commerce Stores: Display product comparisons, sales trends, and customer feedback
Whatever your niche, Chart Blocks for Gutenberg elevates your content with professional data visualization.
📤 Export and Sharing Options 📤
Extend the reach of your charts beyond your website:
One-Click Image Export: Download charts as high-quality PNG or SVG images
PDF Export: Generate PDF documents containing your charts
Social Media Optimization: Charts are designed for perfect social sharing
Embed Codes: Generate embed codes to share your charts on other websites
Print-Friendly Versions: Charts automatically optimize for printed media
Data Download: Allow visitors to download the underlying chart data
These features make your visualizations versatile assets for presentations, reports, and social media.
🌐 Global Community and Support 🌐
Join a thriving community of Chart Blocks for Gutenberg users:
Comprehensive Documentation: Detailed guides for every feature
Video Tutorials: Step-by-step visual instructions
Sample Templates: Pre-built chart configurations for quick starts
Regular Updates: New features and improvements based on user feedback
Dedicated Support: Our team is ready to help solve any issues
User Community: Share tips and tricks with fellow users
Developer Resources: APIs and hooks for custom extensions
You’re never alone when creating data visualizations with our plugin.
🚀 Future-Proof Technology 🚀
Chart Blocks for Gutenberg is built on modern technologies for long-term reliability:
Built on Chart.js: Industry-standard JavaScript charting library
Block Editor Native: Fully embraces WordPress’s future direction
Regular Updates: Continuously enhanced with new features
Structured Data Support: Charts can include Schema.org markup for better SEO
Web Standards Compliant: Follows current HTML5, CSS3, and ES6+ standards
Optimized for Core Web Vitals: Helps maintain excellent page experience scores
Invest in a solution that grows with WordPress and web standards.
✅ Getting Started is Easy ✅
Experience the power of professional data visualization in just a few clicks:
Install the plugin from the WordPress repository
Add a new chart block to any post or page
Enter your data or import from a CSV file
Customize the appearance to match your needs
Publish and impress your visitors
Transform your WordPress content today with Chart Blocks for Gutenberg!
Key Features:
Multiple Chart Types: Choose from bar charts, line charts, pie charts, and more.
Fully Customizable: Customize chart colors, titles, axes, labels, and more.
Responsive Design: Charts automatically adjust to fit any screen size.
Data Inputs: Easily input data manually or upload CSV files for automatic chart generation.
Interactive Charts: Hover effects, tooltips, and more.
Live Data Integration: Integrate external APIs for live data charts (advanced users).
Export Options: Allow users to download charts as images (PNG, SVG).
各版本下載點
- 方法一:點下方版本號的連結下載 ZIP 檔案後,登入網站後台左側選單「外掛」的「安裝外掛」,然後選擇上方的「上傳外掛」,把下載回去的 ZIP 外掛打包檔案上傳上去安裝與啟用。
- 方法二:透過「安裝外掛」的畫面右方搜尋功能,搜尋外掛名稱「Advanced Charts for Gutenberg Blocks Editor」來進行安裝。
(建議使用方法二,確保安裝的版本符合當前運作的 WordPress 環境。
延伸相關外掛(你可能也想知道)
 wpDataTables – WordPress Data Table, Dynamic Tables & Table Charts Plugin 》wpDataTables 是一款流行的 WordPress 插件,可用於快速從 Excel、CSV、XML、JSON、PHP 和其他數據源創建表格和表格圖表。使用我們的 WP 表格插件,以簡潔、...。
 Pricing Table by Supsystic 》使用 Supsystic 的 Pricing Table WordPress 外掛,不需要任何程式技能即可創建出令人驚艷的價格表。選擇合適的價格表模板,使用 Pricing table builder 編輯...。
WP GPX Maps 》這個外掛的輸入是包含使用者運動軌跡的 GPX 檔案,輸出則顯示軌跡地圖和互動式高度圖表((若有))。, 完全可配置:, , 自訂顏色, 自訂圖示, 多種語言支援, ...。
Yes/No Chart 》此外掛提供一個創建一系列應答問題(可回答 “yes / no (/or other)”) 的功能。, 需要 PHP 版本:5.5, 此插件提供創建一個 Yes/No 圖表的功能。, ...。
 Ninja Charts – WordPress Charts and Graphs Plugin 》如果您正在尋找一個能在 WordPress 網站上建立響應式、可自訂和美觀的圖表的外掛程式,那麼您來對了地方。, 我們推薦 Ninja Charts,它是一個資料視覺化解決...。
 Chartify – WordPress Chart Plugin 》WordPress 圖表外掛, , 高級版圖表外掛, 圖表外掛展示, 圖表外掛文件, , WordPress 圖表外掛 可建立靜態與動態圖表、圖形和圖表,以提升您的 WordPress 網站...。
Easy Charts 》這個外掛是一個易於使用、功能強大的方式,可用於生成圖表並在您的網站頁面和文章中展示。使用此外掛創建的圖表易於創建,易於管理。, 使用SVG和CSS3轉換創建...。
 WP Charts and Graphs – WordPress Chart Plugin 》WordPress調查外掛, WP Charts and Graphs外掛在WordPress管理員中提供強大的圖表產生器,您也可以在發佈圖表之前即時在管理員中查看。您只需指定標題和數值...。
 Stockdio Historical Chart 》Stockdio Historical Chart 包含插件和小工具,可提供顯示股票、指數、貨幣或商品的盤中和歷史價格和資訊的功能。支援超過65個不同的股票交易所以及大量市場...。
 Live Gold Price & Silver Price Charts Widgets 》實時黃金價格小工具。包括黃金、白銀、鈀和鉑的價格小工具。此外掛可讓您在任何工具區域中顯示實時黃金和銀價格圖表。, 周一至周五,小工具每分鐘自動更新一...。
 Chart Block – Represent your data by chart 》這個外掛可以呈現表格數據、函數或某些類型的質量結構並提供不同的信息。, 示範, 特色, , 完全可定制: 所有你需要編排展示的選項都在這裡。, 不同類型: 圖表...。
 TablePress Extension: Chartist 》此外掛使用Chartist.js製作,可根據TablePress表格中的資料建立回應式圖表。, 使用方式, 在文章或頁面中新增縮寫碼[table-chart id=123 /],以從TablePress表...。
 Product Price History for WooCommerce 》- 追踪產品價格歷史 - 價格歷史圖表 - 可自定義的圖表 - 顯示過去30天內銷售中產品的最低價格- 可自定義的最低價格消息 - 選擇隱藏價格歷史圖表和/或最低價格...。
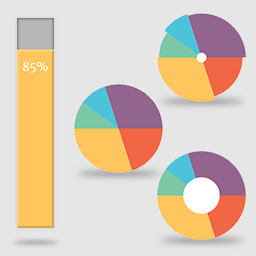 TP PieBuilder 》這個外掛為您提供優雅的長條圖和多種設計和色彩的圓餅圖,例如:預設圓餅圖、環狀圓餅圖和極座標圓餅圖。, 自定義和靈活性, TP PieBuilder 允許您通過短代碼...。
 Stock market charts from finviz 》簡碼 [finviz ticker=GE] 可嵌入finviz.com財務視覺化的股市圖表。, 每次頁面加載時都會動態刷新圖表。, 有選擇直接超鏈接到貼標股票頁面的選項。, , 簡碼 [f...。
