外掛標籤
開發者團隊
原文外掛簡介
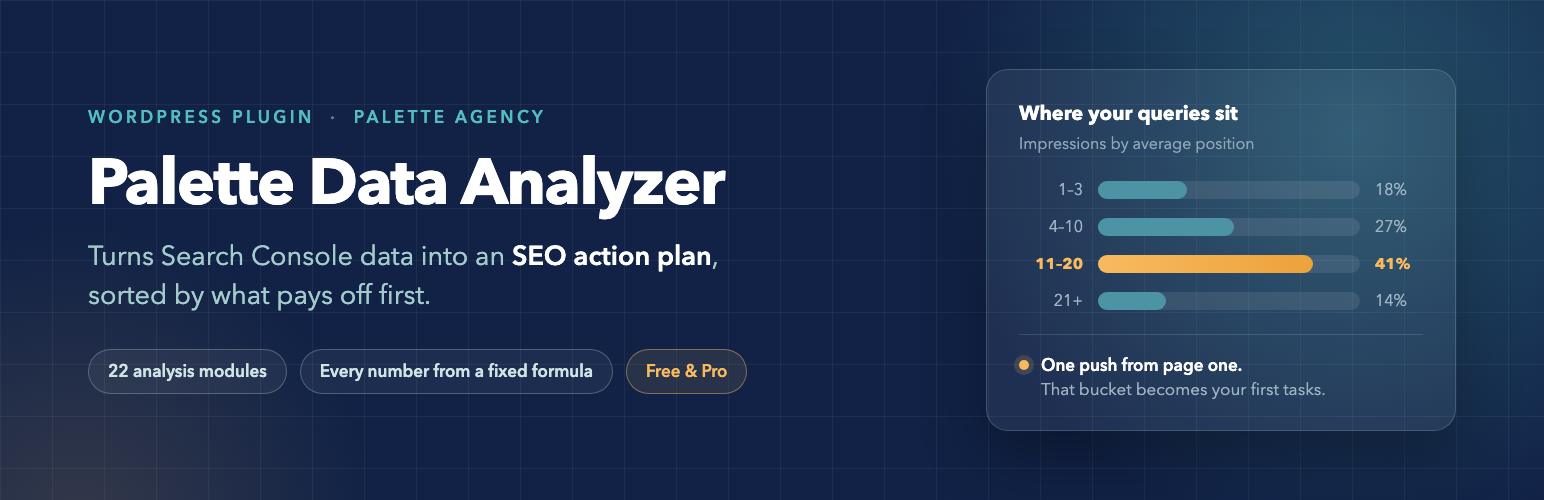
Palette Data Analyzer reads your Google Search Console data and turns it into a report you can act on: which queries are growing, which pages sit just off page one, where your click-through rate is below what your own site normally achieves at that position, and which changes are large enough to be real rather than noise.
Every number is produced by a fixed formula, not by a language model. Run the same file twice and you get the same answer twice.
Two ways to get data in
Upload a file. Export from Search Console as .xlsx, .csv, or the .zip it hands you, and upload it. Any date range works. For the full analysis, enable the “Compare” tab in Search Console so each row carries the previous period too.
Connect the API with the separate Pro add-on. The free plugin does not require an API connection. If you install the separately distributed Palette Data Analyzer Pro add-on, you can connect your Google account and pull reports automatically.
What it measures
Growing and lost queries, page-two opportunities (positions 11-20), top-three opportunities (positions 4-10), abnormally low CTR, position drops that happen despite rising impressions, ranking volatility across several archived reports, big movers, position and CTR distribution by rank bucket, and an overall KPI panel – all feeding one prioritised action plan.
Two things set the analysis apart. Changes are tested against a Poisson noise band, so a query going from 10 clicks to 14 is reported as noise rather than 40% growth. And when your average position moves, the report separates real ranking movement from a shift in which queries earn impressions – the two look identical in a single average but call for completely different responses.
Related plugin
A direct Search Console API connection, single-page analysis and an optional AI summary layer are provided by Palette Data Analyzer Pro, a separately distributed add-on. This plugin is complete on its own and needs none of them.
External services
Google connectivity check (www.googleapis.com) – contacted only when an administrator presses the connection-test button on the settings screen. It sends nothing beyond the request itself, and reports whether this server can reach Google at all.
Google Privacy Policy
Google Search Status Dashboard (status.search.google.com) – an optional public JSON feed used to label reports with ranking updates. It is disabled by default and is contacted only after an administrator enables it on the upload screen. Your server contacts the service at most once every 12 hours; the plugin does not send report data, Google credentials, or your site URL. As with any web request, the service receives normal connection metadata such as your server IP address.
Google Privacy Policy
Chart.js 4.4.0 – charting library, MIT license.
File: assets/js/chart.umd.min.js
License: licenses/chartjs-MIT.txt
Source: https://github.com/chartjs/Chart.js
Vazirmatn font 33.0.3 (variable, weights 100-900) – SIL Open Font License 1.1.
File: assets/fonts/Vazirmatn-Variable.woff2 – full license: assets/fonts/LICENSE.txt
Source: https://github.com/rastikerdar/vazirmatn