
內容簡介
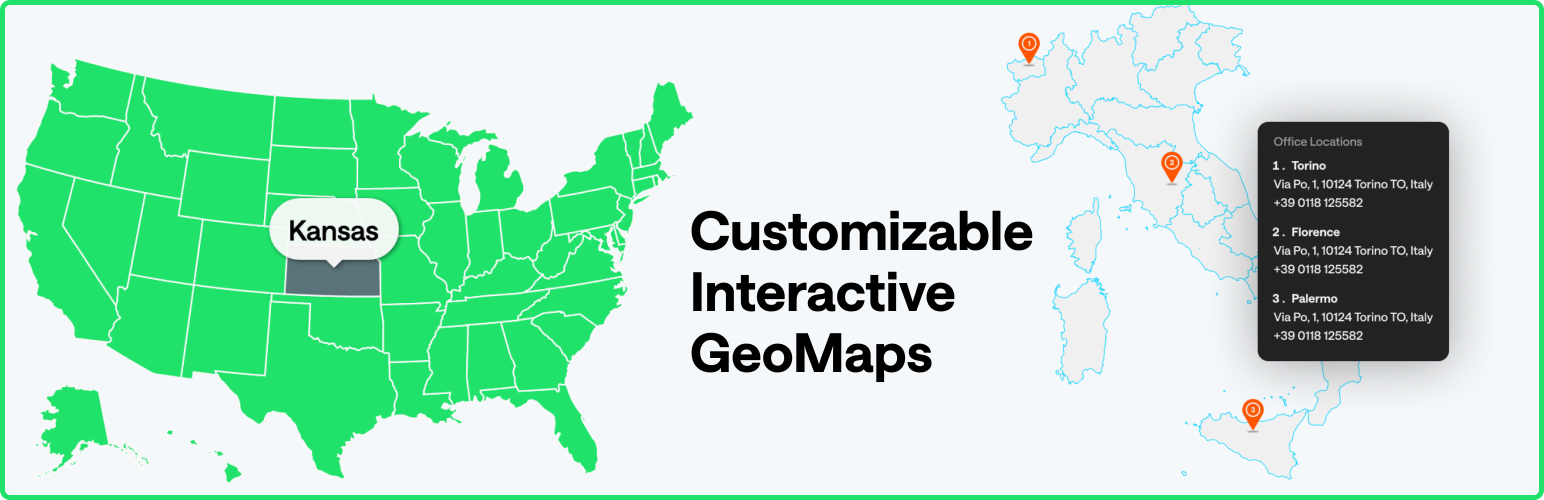
MapGeo 是一款互動地圖外掛,讓使用者能夠輕鬆創建帶有區域和顏色標記的互動地圖。支援全球地圖、洲地圖及單一國家地圖,適合用於顯示旅遊地點、辦公室位置等。
【主要功能】
• 創建無限數量的互動地圖
• 支援響應式設計及跨裝置使用
• 自訂顏色標記及區域
• 設定懸停顏色變化
• 提供多種地圖投影選擇
• 顯示 HTML 工具提示
外掛標籤
開發者團隊
② 後台搜尋「MapGeo – Interactive Geo Maps」→ 直接安裝(推薦)
📦 歷史版本下載
原文外掛簡介
Create interactive maps with regions and coloured markers. You can display the world map, continent maps and single country maps.
Demo | Admin Demo | Maps | Documentation | Pro
More than 250 vector maps available
World map (with and without Antarctica)
World map divided by continents (different variations)
Maps of continents and regions (Africa, Asia, Caribbean, Central America, Europe, Latin America, Middle East, North America, Oceania, South America )
US States divided by counties (California, Texas, Florida, New York and all the others)
Mexico county maps
Canada county maps
Most countries in the world, including United States of America (USA), Germany, France, United Kingdom (UK), Netherlands, Spain, Australia, Italy, Poland, South Africa, Brazil, India, Japan and many others.
Some countries with different map variations like France, divided by regions or departments, Portugal divided by districts or municipalities, among others.
Create your first interactive map in minutes! Use it to display your visited countries map, travel map, office locations, projects map, representatives map, statistics map, data visualization map or any other thing!
Browse Full List of Maps
Features
Create as many maps as you want
Responsive and cross-device
Color countries
Add round coloured markers
Set hover color change
Set click actions, like open a new window
Choose from different map projections (Mercator, Miller, NaturalEarth1, among others)
Select which regions to display in a map
Exclude specific regions from a map
Display HTML tooltips on hover
Zoom controls and Pan
Pro only Features
Colour regions and markers individually
Change initial zoom and center
Cluster markers
Add Legend
Custom images as markers
Vector icons as markers
Text Labels
Display content on click outside the map
Display content in a lightbox
Group regions
Create heatmaps (choropleth maps)
Add lines connecting markers
Overlay different maps (have US states map on world map for example)
Populate map automatically from existing categories or Tags
Advanced zoom options
Features Examples | Go Pro
The plugin generates interactive, responsive, touch-enabled SVG maps which are embedded directly into your HTML5 pages and compatible with all modern browsers and devices.
Privacy Information & External Services
This plugin will build the maps using the amcharts visualization library which provides hundreds of different maps. The plugin loads some files from their CDN to build the map and display it on your page. You won’t need to have a amcharts account for the maps to work. More information about their amcharts Privacy Policy.
When you first install the plugin, you can choose to opt-in to share non-sensitive data with Freemius, a framework we use to collect data about your WordPress installation that will help us improve the plugin. This is optional and the plugin will still work if you don’t opt-in. It will not collect any data from your visitors.
Credits
amcharts
jsonTree
autocomplete
unDraw – Banner Illustrations
Codestar Framework
Extended CPTs