
內容簡介
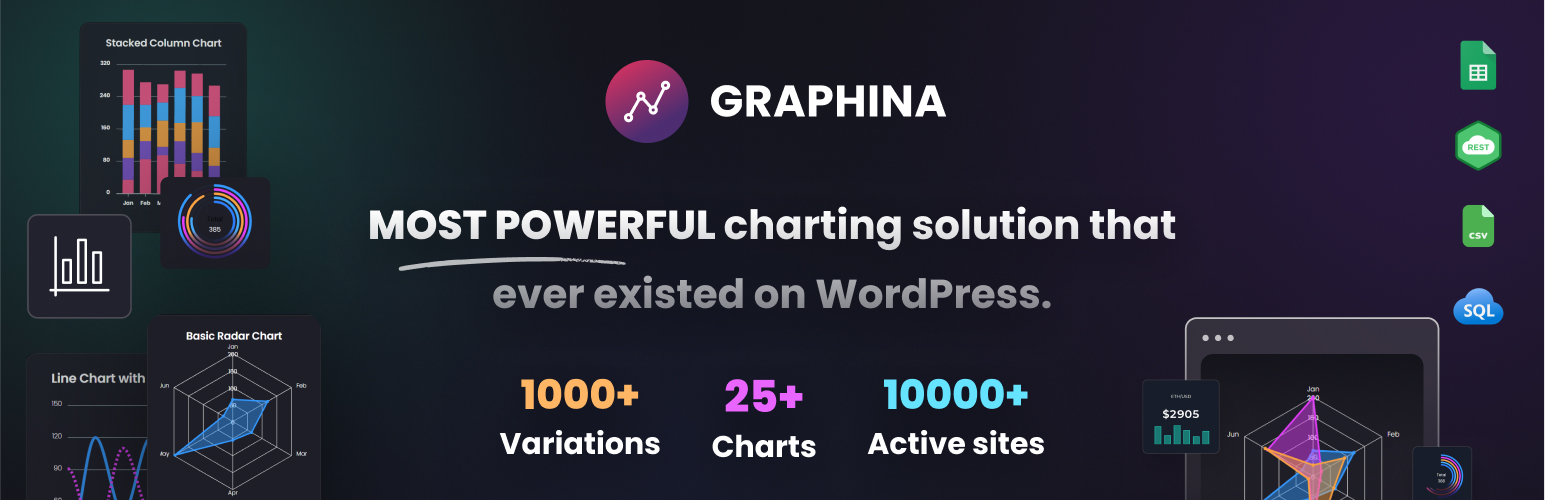
Graphina 是一款強大的 WordPress 外掛,專為 Elementor 設計,讓使用者能輕鬆快速地創建各種圖表與數據視覺化。它提供超過 14 種圖表類型及 1000 多種變化,並具備動態加載功能,提升網站效能。
【主要功能】
• 超過 14 種圖表類型
• 1000+ 圖表變化選項
• AJAX 數據加載提升速度
• 動態圖表功能(PRO 版)
• 支援多種數據視覺化元素
外掛標籤
開發者團隊
② 後台搜尋「Graphina – Charts and Graphs For Elementor」→ 直接安裝(推薦)
📦 歷史版本下載
原文外掛簡介
Its like WordPress Elementor Charts on STEROIDS* 💊
Creating WordPress Charts and Graphs is hard and boring. We make it a whole lot EASIER, QUICKER, more POWERFUL, and more FUN.
With the most ruthlessly effective Charts & Graphs plugin for rapidly implementing data visualization in WordPress like no other.
Graphina introducing Graphina – Divi Charts and Graphs for Divi page builder.
DEMO | PRO | GUTENBERG | Firebase Addon | Forminator Addon | DOCS | Videos
👋 Welcome to the most powerful charting solution that ever existed on WordPress – Graphina.
It’s just magical for implementing data visualization in your Elementor websites. It is a versatile WordPress plugin that allows you to create 14+ graphs and charts with over 1000+ variations. Build on the popular Apex charts, Graphina has a ton of options, wide range of charts and adaptability.
Its AJAX data loading makes sure that your site speed is not hampered. and I know thats important! isn’t it ?
And Did I say “Dynamic Charts”? Yes with PRO version you can simply take charting experience to whole new level. Stay tunned!
Check these unbelievably immersive pages built with Graphina. 😲
Crypto Stats
Ecomm dashboard
Environment Report
Server Stats
School Report
Hotel Report
A quick tour of Graphina
IMP : ELEMENTOR IS REQUIRED FOR THIS PLUGIN.
15+ Ruthlessly Powerful Charts & Data visualization elements. 💪
Line Chart Amazingly unique 5+ style of Line charts.
Column/Bar Chart Easiest and most versatile bar charts.
Nested Column Chart Advanced bar chart to easily show nested data.
Area Chart Most Popular chart show overall trends in data.
Pie Chart Include Pie chart on your site with just few clicks.
Donut Chart Represent the proportional data or relative data.
Candle Chart Show trading data like stocks, cryptocurrencies.
Radar Chart Display data across multiple unique dimensions.
Radial Chart Create highly customizable radial charts.
Bubble Chart Visualize relationships between Multiple variables.
Polar Chart Show scientific & research data in easily.
Heatmap Chart Visualize the volume of data within a dataset.
Timeline Chart Great tool to vizualize progression over time.
Mix Chart Get power to show multiple chart type in one.
Data Tables Most traditional and effective way to show data.
Counters Highlight your key metrics with our counters.
Jquery Datatable Most traditional and effective way to show data.
Distributed Chart Easiest and most versatile Distributed charts.
Brush Chart Easiest and most versatile Brush charts.
Scatter Chart Easiest and most versatile Scatter charts.
GOOGLE CHARTS (New)
Google Line Chart
Google Column Chart
Google Pie Chart
Google Area Chart
Google Bar Chart
Google Donut Chart
Google Geo Chart
Google Guage Chart
Google Org Chart
Google Gantt Chart
Turn your PICASSO Mode ON with 100s of Customization options.
Who said we devs are not artists? Whith these options anyone can paint a masterpiece.
Set Custom Color for Charts
3 Type of chart fill setting – classic, gradient and pattern
Customize Chart Cards
Multiple Chart Legend Positioning
Chart datalabel Settings
XY Axis settings
Mutliple Y-axis title option
Marker Style Settings
Chart Drop Shadow Settings
Chart Background Color Settings
Prefix and postfix in x-axis/yaxis label and in datalabel
Optional Commas seperator ( 1000 => 1,000)
Format Number to String ( Convert 1,000 => 1k and 1,000,000)
Dynamic Change Chart Type (Example Line-> to Area or Column)
Stacked line (Area, Line)
Series Value in Legend
Large String in Categories
Chart Admin Setting Page
Realtime change chart type for same data
PRO Features- When we say POWERFUL, we literaly mean it.
Dynamic charts with data from GOOGLE SHEETS
Create charts from LOCAL & REMOTE CSV
Create charts from APIs
Create charts from FIREBASE
Create charts from SQL Queries to Database
AJAX based auto reloading of data from source
User ID based data from API and SQL query
Password Protect your charts. Demo
Role based view restriction options
User Id based view restriction options
Export Chart data to PNG, SVG, CSV
Realtime change chart type for same data
Exclusive Scatter chart
Conditional Colors for Counters
Chart Filter in API and SQL Builder Dynamic Option
External mysql database connectivity
Dynamic Key in API and SQL Builder Dynamic Option (Example https://documentation.iqonic.design/graphina/graphina-pro/unlocking-the-power-of-dynamic-keys-in-wordpress)
Create charts from Column wise csv/remote-csv/googlesheet (select specific column for x/y-axis of chart from csv/remote-csv/googlesheet file)
Create charts from any data source using graphina filters( https://documentation.iqonic.design/graphina/graphina-pro/retrieving-dynamic-data-using-wordpress-filters)
Check our all Tutorial videos on Youtube –> CLICK HERE
Graphina has extremely intuitive settings that creating a chart is almost like a childplay. All you need is to add your data points, adjust the grid display, and change the colors, fonts, paddings, and margins for elements as per your preference. And yes all this can be configured directly from the Elementor’s interface and does not require any additional code knowledge. Isn’t that genius?
Graphina for Elementor is brilliantly compatible with all modern browsers like Chrome, Firefox, Opera, Safari, or Edge. Your website will look great on all devices and in all browsers.
With PRO version you get the powers to create DYNAMIC Charts like a GOD! 💪
And did I say its RISK FREE ? 😃
I am so confident about Graphina PRO’s benefits that once you try it there is no looking back. Just in case it doesn’t fit your needs then we offer 60 DAYS MONEY BACK GUARANTEE. (Yes that’s for real!!)
Check these quick links to Graphina Family Products
Graphina PRO
Firebase Extension
Graphina Gutenberg Version
FEEDBACK
Submit a feature request HERE. and sssshhh!! we listen very carefully!
YOU ARE IN GOOD COMPANY
Graphina is crafted by team IQONIC – expert, young, & dynamic creators of community focused digital products and trusted by over 100K individuals and businesses.
DOCUMENTATION AND SUPPORT
Check our online Documentation HERE .
For our PRO version owners our experts provide support via https://iqonic.desky.support portal.
HOLD ON THERE TIGER,…NOT SO FAST. WE HAVE MORE FREE STUFF.
We simply love our community and we can’t stop ourselves from creating great products for you. Don’t miss to check these. I promise you’ll be amazed
👉 MARVY – Coolest background animations for Elementor page builder.
👉 Kivicare – One and only Medical EHR solution on WordPress. Built with by VUE JS and Experience is like pure MAGIC. Do try it out.
👉 WP Roadmap – Create product roadmap and feedback board with ease.
👉 JOIN THE COMMUNITY
Did you check these 100+ mind blowing free for community products.Be an exclusive part of the community and level up your digital game.
JOIN NOW
Say Hi on SOCIAL MEDIA
Instagram
Youtube
Dribbble
Facebook
Twitter