
內容簡介
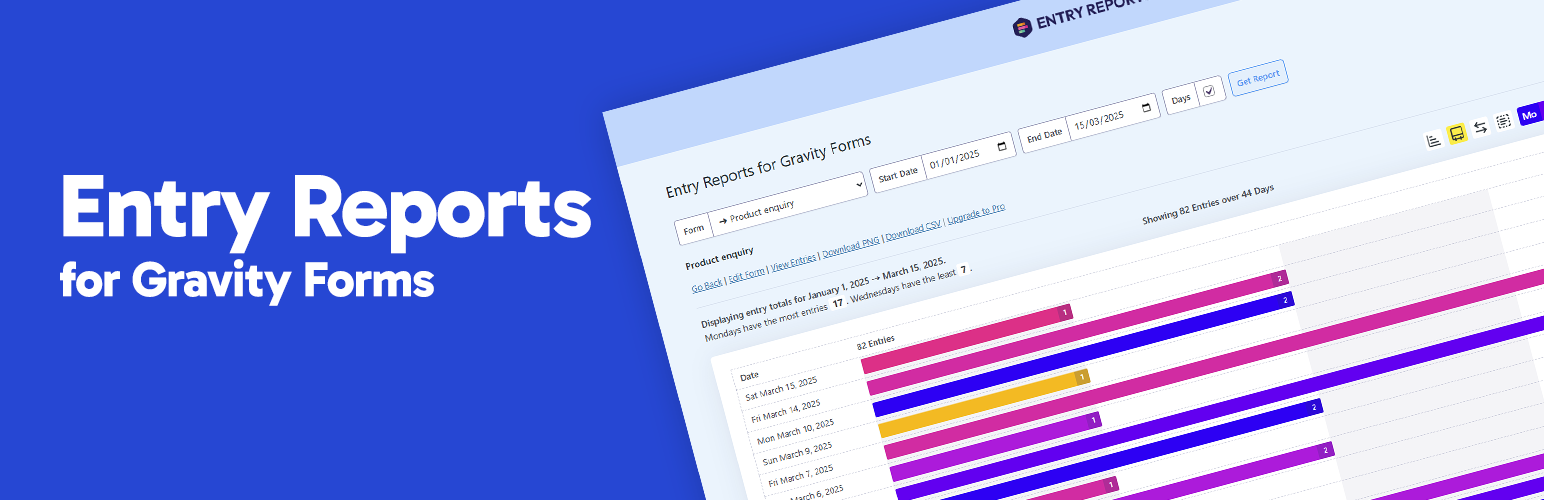
總結文案:Entry Reports for Gravity Forms提供清晰且視覺化的表單提交數據概述,只需選擇一個表單並設定日期範圍,即可看到在該時期內每天提交的條目數。
問題與答案:
問題:何時很有用處?
答案:
- 您可能正在進行市場營銷活動,希望追蹤表單的表現
- 您想好奇地查看任何特定日期範圍內的條目趨勢
- 您需要一種快速方式將提交活動傳達給您的團隊或客戶
問題:升級至PRO有什麼好處?
答案:
- 數據導出:快速導出為CSV格式
- 自動郵件報告:安排在特定日期和時間自動發送報告給選定的收件人
- 日曆熱度圖:以色彩密度顯示每日提交活動,以便視覺化時間趨勢
- 按小時提交趨勢:立即查看何時提交達到高峰,為任何選定的日期提供每小時的詳細分析
- 自定義圖表顏色:使用預設的預設值或選擇您自己的顏色,輕鬆調整圖表顏色
- 一鍵圖表截圖:保存PNG格式的圖表
外掛標籤
開發者團隊
② 後台搜尋「Entry Reports for Gravity Forms」→ 直接安裝(推薦)
原文外掛簡介
Entry Reports for Gravity Forms gives you a clear, visual breakdown of form submissions over time. Just pick a form and set your date range to see exactly how many entries were submitted each day within that period.
When is this useful?
You might be running a marketing campaign and want to track form performance over time
You’re curious to see entry trends across any specific date range
You need a quick way to relay submission activity to your team or clients
Support
Free Plugin Support | Pro Plugin Support
Requirements
Gravity Forms 2.4 or higher
WordPress 6.0 or higher
PHP 8.1
Upgrade to PRO
What are the benefits of PRO?
Export Data: Quickly export to CSV.
Automated Email Reports: Schedule reports to be automatically sent to selected recipients at specific days and times.
Calendar heat map: Show daily submission activity with color-coded intensity to visualise trends over time.
Submission trends by hour:Instantly see when submissions peak with an hourly breakdown for any selected day.
Customise Chart Colours: Easily adjust chart colours using either baked-in presets or choose your own.
One-click chart screenshots: Save charts to PNG.
Upgrade to PRO