
內容簡介
總結:DebugHawk 是一款用於 WordPress 網站的性能調試和監控外掛,提供深入洞察前端和後端性能狀況,僅有專為 WordPress 而建的工具才能提供的清晰度。
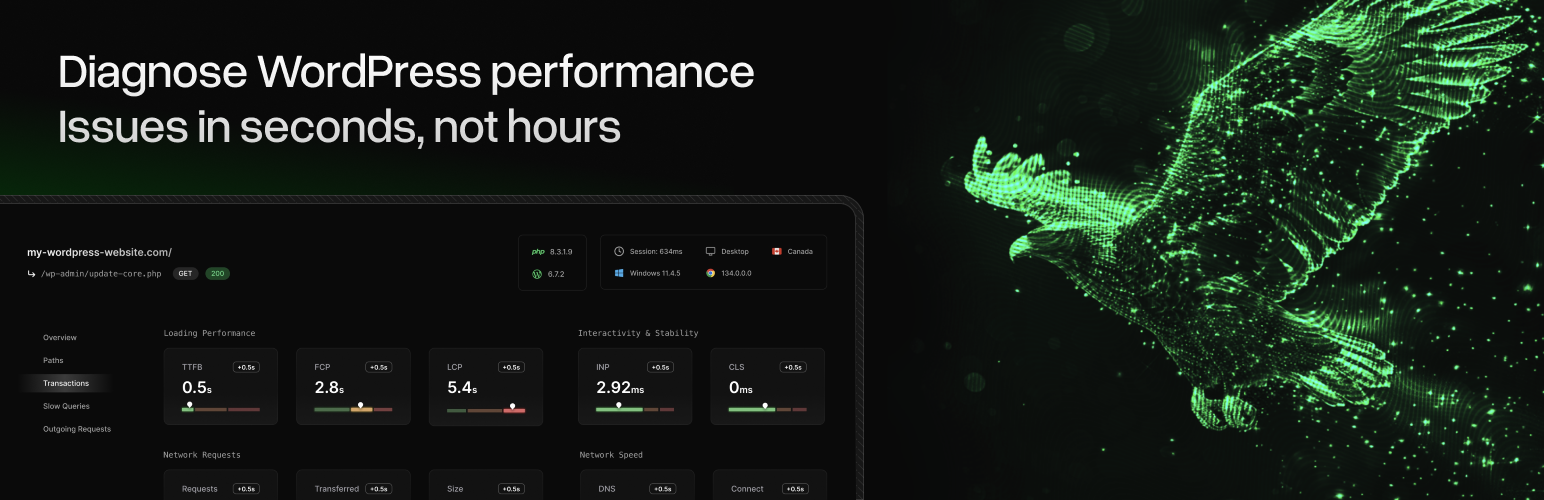
1. 前端性能追蹤內容:
- 核心網頁要素(LCP、INP、CLS、TTFB、FCP)
- 網路性能指標(DNS 查詢、連接時間)
- 瀏覽器資源追蹤(請求、網頁大小、傳輸尺寸)
2. 後端性能追蹤內容:
- PHP 執行時間和記憶體使用量
- 資料庫查詢執行效能和數量
- 外部 HTTP 請求時間
- 物件快取效能
- 頁面快取效果
- 重新導向
3. 外掛運作方式:
- 設定後,DebugHawk 會自動:
- 監控性能:追蹤每次頁面載入時的 PHP 執行時間、資料庫查詢和記憶體使用量
- 收集瀏覽器指標:注入輕量級 JavaScript 信標,收集核心網頁要素及資源時間
- 加密資料:在傳輸前對所有收集的資料進行加密
外掛在設定後無需額外使用者互動即能透明地運作。
外掛標籤
開發者團隊
② 後台搜尋「DebugHawk – WordPress Performance Monitoring & Debugging」→ 直接安裝(推薦)
原文外掛簡介
Monitor and debug WordPress performance issues with DebugHawk – the performance monitoring tool built specifically for WordPress developers and site owners who need to identify what’s slowing down their site.
Why WordPress Sites Are Slow
Slow WordPress sites lose visitors, conversions, and search rankings. But identifying the root cause is difficult when frontend tools like Google PageSpeed Insights only show part of the picture.
DebugHawk monitors both frontend and backend performance so you can see exactly what’s slowing down your WordPress site – whether it’s slow database queries, external API calls, or frontend Core Web Vitals problems.
What DebugHawk Monitors
Frontend Performance Metrics:
Core Web Vitals – LCP (Largest Contentful Paint), INP (Interaction to Next Paint), CLS (Cumulative Layout Shift), TTFB (Time to First Byte), FCP (First Contentful Paint)
Network Performance – DNS lookup time, connection time
Browser Resources – HTTP requests, page weight, transfer sizes
Backend Performance Tracking:
Database Query Performance – Slow queries, query count, total database time
PHP Execution – Execution time, memory usage
External HTTP Requests – API call timing, external service performance
Object Cache Performance – Hit ratio, cache effectiveness
Page Cache Effectiveness – Cache hits vs misses
Redirect Detection – Unnecessary redirects slowing page loads
Debug Slow WordPress Sites
Unlike generic performance tools, DebugHawk understands WordPress architecture. It shows you:
Which plugins are causing slow database queries
Which external APIs are timing out
Whether your caching is working effectively
Perfect for WordPress developers, agencies managing multiple sites, and site owners who need to diagnose performance issues quickly.
How It Works
Automatic Monitoring – Once configured, DebugHawk tracks performance on every page load
Real User Monitoring (RUM) – See actual performance data from your real visitors, not synthetic tests
Historical Data – Track performance over time, identify when issues started
Encrypted Transmission – All data is encrypted before sending to DebugHawk’s dashboard
No impact on site performance – the monitoring overhead is negligible.
Perfect For
WordPress Developers debugging slow queries and performance bottlenecks
Agencies monitoring client site performance across multiple WordPress sites
Site Owners who need to understand why their WordPress site is slow
WooCommerce Stores tracking checkout performance and database optimization
Membership Sites monitoring server load and query performance
Get Started
Sign up for a free trial at DebugHawk.com
Install and activate this plugin
Add your site configuration to wp-config.php
Start monitoring your WordPress performance