
內容簡介
此外掛在啟用時會在 wp-config.php 中設定以下偵錯常數,並在停用時移除它們。任何錯誤都會導致拋出 PHP Exception。偵錯常數請參考 WordPress 的「Debugging in WordPress」頁面。
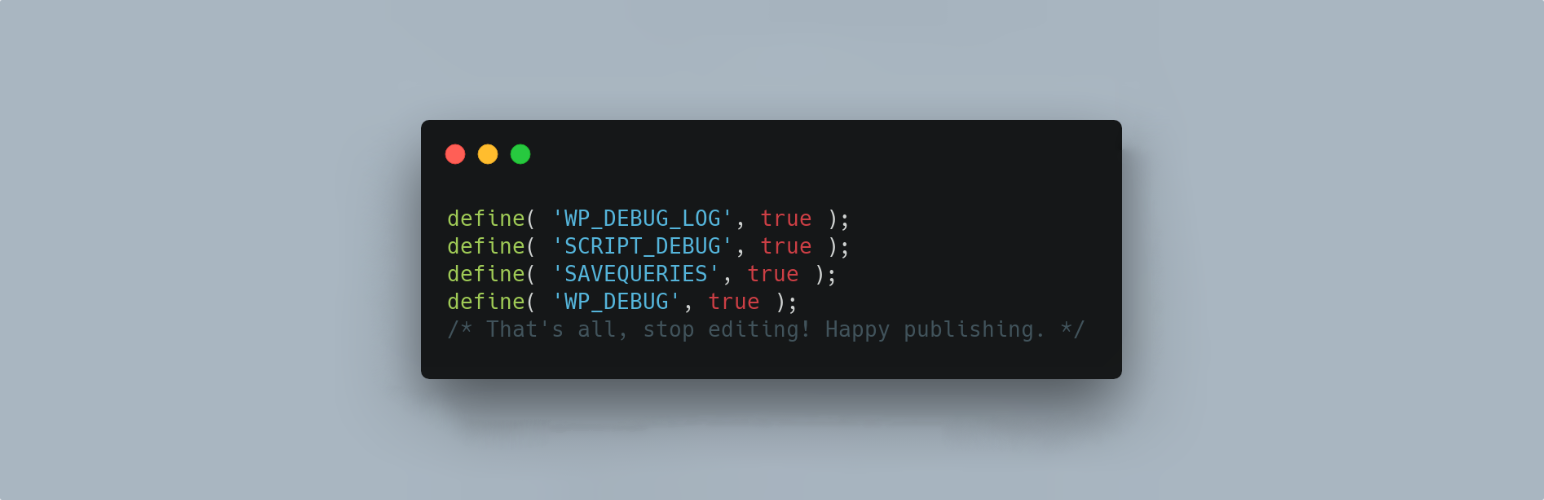
預設設定如下:
define( 'WP_DEBUG_LOG', true );
define( 'SCRIPT_DEBUG', true );
define( 'SAVEQUERIES', true );
啟用此外掛時也會設置 `@ini_set( 'display_errors', 1 )`。當此外掛首次運行時,`WP_DEBUG` 會設置為 true;之後便可在設定中關閉。
使用者可以在設定頁面中設置以下項目:
define( 'WP_DEBUG', true ); //(設定此項目)初始安裝時為預設值。
define( 'WP_DEBUG_DISPLAY', false ); //(未指定時的預設值為)true。
define( 'WP_DISABLE_FATAL_ERROR_HANDLER', true ); //WordPress 5.2 白屏處理。
當停用此外掛時,會盡力恢復先前存在的常數為其原狀。啟用此外掛時,會恢復預設值和任何已保存的設定。
此外掛使用 wp-cli/wp-config-transformer 命令將常數寫入 wp-config.php。
隨附此外掛的 Andrew Norcross 的「Debug Quick Look」有助於讀取 debug.log 檔案。若已安裝該外掛,但 WP 偵錯未啟用,應刪除它。
「Query Monitor」和「Debug Bar」外掛是可選依賴關係,有助於除錯和疑難排解。若已忽略安裝通知,45 天後會再次提醒。
如您的 wp-config.php 檔案位於非標準位置,可以使用 wp_debugging_config_path 過濾器來返回您的安裝檔案路徑。
wp_debugging_add_constants 過濾器可讓使用者向 wp-config.php 添加常數。
過濾器返回一個陣列,其中鍵是常數名稱,而值是包含作為字符串和指示是否應傳遞而不帶引號的布林值的數據陣列。
$my_constants = [
'my_test_constant' =>
[
'value' => 'abc123',
'raw' => false,
],
'another_test_constant' => [ 'value' => 'true' ],
];
value 選項包含常數的值作為字符串。
raw 選項表示,不是將值作為字符串放入 config 中,而是不加引號地放入。預設值為 true。對於非布林值,可將其設為 false。
例如:
add_filter(
'wp_debugging_add_constants',
function( $added_constants ) {
$my_constants = [
'my_test_constant' => [
'value' => '124xyz',
'raw' => false,
],
'another_test_constant' => [ 'value' => 'true' ],
];
return array_merge( $added_constants, $my_constants );
},
10,
1
);
這將創建以下常數:
define( 'MY_TEST_CONSTANT', '124xyz' );
define( 'ANOTHER_TEST_CONSTANT', true );
開發中。
外掛標籤
開發者團隊
📦 歷史版本下載
原文外掛簡介
This plugin sets the following debug constants in wp-config.php on plugin activation and removes them on plugin deactivation. Any errors will result in a PHP Exception being thrown. Debug constants per Debugging in WordPress.
Default settings:
define( 'WP_DEBUG_LOG', true );
define( 'SCRIPT_DEBUG', true );
define( 'SAVEQUERIES', true );
@ini_set( ‘display_errors’, 1 ); is set when the plugin is active. WP_DEBUG is set to true when the plugin is first run, thereafter it can be turned off in the Settings.
The Settings page allows the user to set the following.
define( 'WP_DEBUG', true ); // Default on initial plugin installation.
define( 'WP_DEBUG_DISPLAY', false ); // Default when not declared is true.
define( 'WP_DISABLE_FATAL_ERROR_HANDLER', true ); // WordPress 5.2 WSOD Override.
When the plugin is deactivated best efforts are made to re-add pre-existing constants to their former state. When the plugin is activated the default settings and any saved settings are restored.
This plugin uses the wp-cli/wp-config-transformer command for writing constants to wp-config.php.
Debug Quick Look from Andrew Norcross is included with this plugin to assist in reading the debug.log file. If you already have this plugin installed you should delete it when WP Debugging is not active.
Query Monitor and Debug Bar plugins are optional dependencies to aid in debugging and troubleshooting. The notice for installation will recur 45 days after being dismissed.
If you have a non-standard location for your wp-config.php file you can use the filter wp_debugging_config_path to return the file path for your installation.
The filter wp_debugging_add_constants allows the user to add constants to wp-config.php.
The filter returns an array where the key is the name of the constant and the value is an array of data containing the value as a string and a boolean to indicate whether or not the value should be passed without quotes.
$my_constants = [
'my_test_constant' =>
[
'value' => 'abc123',
'raw' => false,
],
'another_test_constant' => [ 'value' => 'true' ],
];
The value option contains the constant’s value as a string.
The raw option means that instead of placing the value inside the config as a string it will become unquoted. The default is true. Set as false for non-boolean values.
Example:
add_filter(
'wp_debugging_add_constants',
function( $added_constants ) {
$my_constants = [
'my_test_constant' => [
'value' => '124xyz',
'raw' => false,
],
'another_test_constant' => [ 'value' => 'true' ],
];
return array_merge( $added_constants, $my_constants );
},
10,
1
);
This will create the following constants.
define( 'MY_TEST_CONSTANT', '124xyz' );
define( 'ANOTHER_TEST_CONSTANT', true );
Development
PRs are welcome against the develop branch on GitHub.